Stats Software Minimal
This carefully crafted Stats component is perfect for Software landing pages, featuring a Minimal design that looks great and converts well.
Simply copy the code with the "Copy" button, paste it into your project and customize the colors, text and images to match your brand.
<!--
@type: Stats
@industry: Software
@style: Minimal
@category: Page Section, Social Proof
@framework: HTML/CSS
@license: Free
-->
<style>
:root {
--color-white: #ffffff;
--color-gray-50: #f9fafb;
--color-gray-100: #f3f4f6;
--color-gray-200: #e5e7eb;
--color-gray-300: #d1d5db;
--color-gray-500: #6b7280;
--color-gray-600: #4b5563;
--color-gray-700: #374151;
--color-gray-900: #111827;
--color-indigo-200: #c7d2fe;
--color-indigo-500: #6366f1;
--color-indigo-600: #4f46e5;
--color-indigo-700: #4338ca;
--shadow-sm: 0 1px 2px 0 rgb(0 0 0 / 0.05);
}
* {
box-sizing: border-box;
margin: 0;
padding: 0;
font-family: ui-sans-serif, system-ui, sans-serif, "Apple Color Emoji", "Segoe UI Emoji", "Segoe UI Symbol", "Noto Color Emoji";
}
.stats-section {
background-color: var(--color-white);
padding: 4rem 1rem;
}
@media (min-width: 640px) {
.stats-section {
padding: 6rem 1.5rem;
}
}
.container {
max-width: 80rem;
margin: 0 auto;
}
@media (min-width: 640px) {
.container {
padding: 0 1.5rem;
}
}
@media (min-width: 1024px) {
.container {
padding: 0 2rem;
}
}
.content {
margin: 0 auto;
}
@media (min-width: 1024px) {
.content {
max-width: none;
}
}
.stats-header {
text-align: center;
}
.header-badge {
font-size: 1.125rem;
font-weight: 600;
color: var(--color-indigo-600);
}
.header-title {
margin-top: 0.5rem;
font-size: 1.875rem;
font-weight: 700;
letter-spacing: -0.025em;
color: var(--color-gray-900);
}
@media (min-width: 640px) {
.header-title {
font-size: 2.25rem;
}
}
.header-description {
margin-top: 1rem;
font-size: 1.125rem;
color: var(--color-gray-600);
}
.stats-grid {
margin-top: 4rem;
display: grid;
grid-template-columns: 1fr;
gap: 2.5rem 2rem;
}
@media (min-width: 640px) {
.stats-grid {
grid-template-columns: repeat(2, 1fr);
}
}
@media (min-width: 1024px) {
.stats-grid {
grid-template-columns: repeat(4, 1fr);
}
}
.stat-card {
position: relative;
background-color: var(--color-white);
padding: 1.5rem;
border: 1px solid var(--color-gray-200);
border-radius: 0.5rem;
box-shadow: var(--shadow-sm);
}
.stat-icon {
position: absolute;
display: flex;
align-items: center;
justify-content: center;
width: 3rem;
height: 3rem;
border-radius: 0.375rem;
background-color: var(--color-indigo-500);
color: var(--color-white);
}
.stat-icon svg {
width: 1.5rem;
height: 1.5rem;
}
.stat-title {
margin-left: 4rem;
font-size: 1.125rem;
font-weight: 500;
color: var(--color-gray-900);
}
.stat-content {
margin-left: 4rem;
margin-top: 0.5rem;
}
.stat-value {
font-size: 1.875rem;
font-weight: 700;
letter-spacing: -0.025em;
color: var(--color-indigo-600);
}
.stat-description {
margin-top: 0.25rem;
font-size: 0.875rem;
color: var(--color-gray-500);
}
.calculator {
margin-top: 4rem;
background-color: var(--color-gray-50);
border: 2px solid var(--color-indigo-200);
border-radius: 0.75rem;
padding: 2rem;
}
.calculator-container {
max-width: 48rem;
margin: 0 auto;
}
.calculator-title {
font-size: 1.25rem;
font-weight: 700;
color: var(--color-gray-900);
margin-bottom: 1.5rem;
}
.calculator-grid {
display: grid;
grid-template-columns: 1fr;
gap: 1.5rem;
}
@media (min-width: 768px) {
.calculator-grid {
grid-template-columns: 2fr 1fr;
}
}
.input-grid {
display: grid;
grid-template-columns: 1fr;
gap: 1rem;
}
@media (min-width: 640px) {
.input-grid {
grid-template-columns: repeat(2, 1fr);
}
}
.input-group {
display: flex;
flex-direction: column;
}
.input-label {
display: block;
font-size: 0.875rem;
font-weight: 500;
color: var(--color-gray-700);
margin-bottom: 0.5rem;
}
.input-field {
display: block;
width: 100%;
padding: 0.75rem 1rem;
font-size: 1rem;
border: 1px solid var(--color-gray-300);
border-radius: 0.375rem;
box-shadow: var(--shadow-sm);
}
.input-field:focus {
outline: none;
border-color: var(--color-indigo-500);
box-shadow: 0 0 0 1px var(--color-indigo-500);
}
.results {
background-color: var(--color-white);
padding: 1.5rem;
border-radius: 0.5rem;
border: 1px solid var(--color-gray-300);
box-shadow: var(--shadow-sm);
}
.results-label {
font-size: 0.875rem;
font-weight: 500;
color: var(--color-gray-500);
margin-bottom: 0.5rem;
}
.results-value {
font-size: 1.875rem;
font-weight: 700;
color: var(--color-indigo-600);
}
.results-cta {
margin-top: 1rem;
padding-top: 1rem;
border-top: 1px solid var(--color-gray-100);
}
.cta-button {
display: inline-flex;
align-items: center;
justify-content: center;
padding: 0.75rem 1.25rem;
font-size: 1rem;
font-weight: 500;
color: var(--color-white);
background-color: var(--color-indigo-600);
border: none;
border-radius: 0.375rem;
text-decoration: none;
box-shadow: var(--shadow-sm);
transition: background-color 0.2s;
}
.cta-button:hover {
background-color: var(--color-indigo-700);
}
.cta-button:focus {
outline: none;
box-shadow: 0 0 0 2px var(--color-white), 0 0 0 4px var(--color-indigo-500);
}
</style>
<section class="stats-section" aria-labelledby="stats-heading">
<div class="container">
<div class="content">
<div class="stats-header">
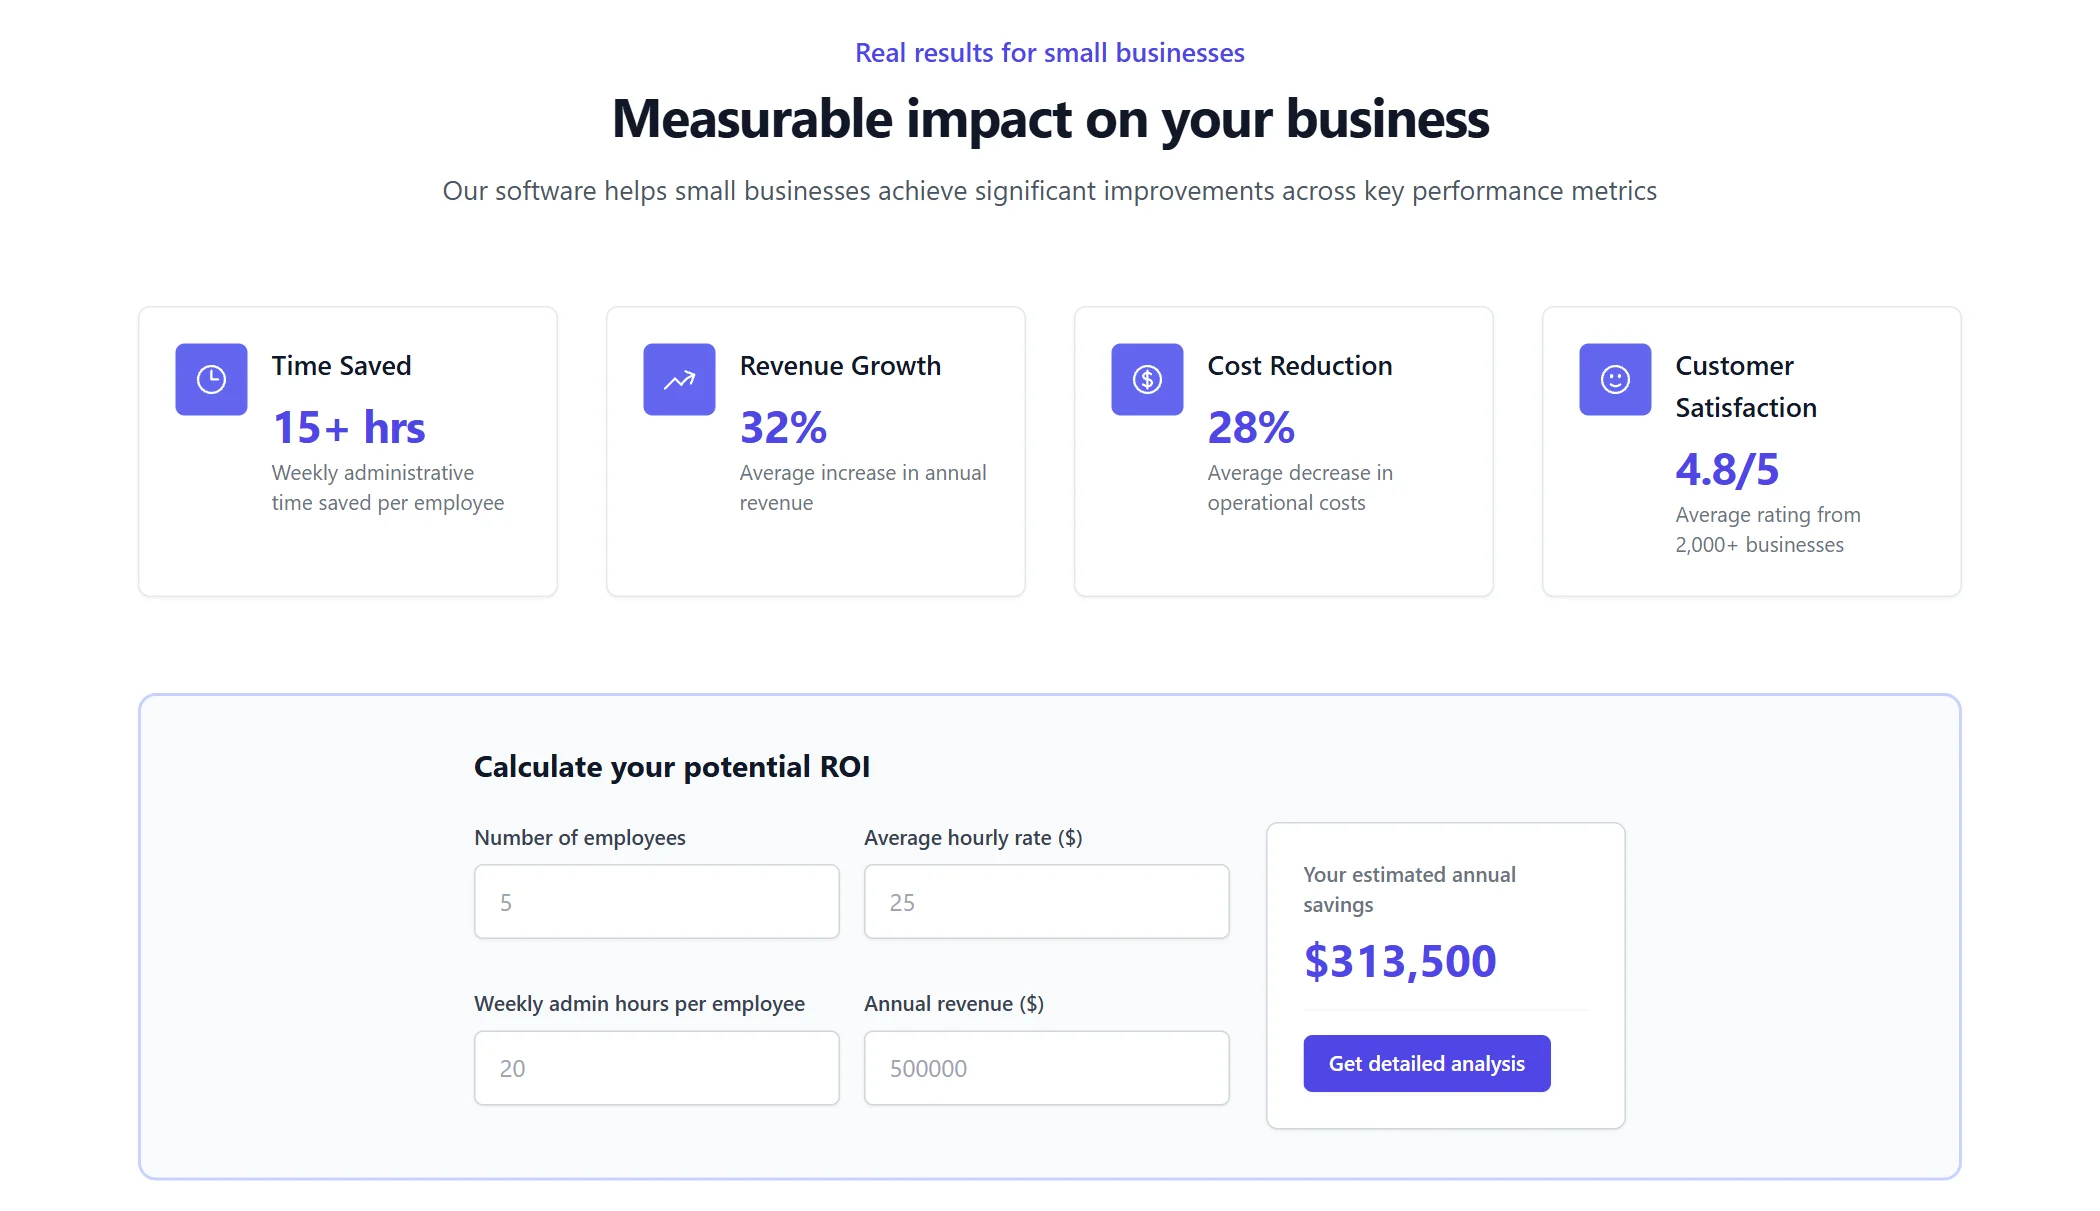
<span class="header-badge">Real results for small businesses</span>
<h2 id="stats-heading" class="header-title">
Measurable impact on your business
</h2>
<p class="header-description">
Our software helps small businesses achieve significant improvements across key performance metrics
</p>
</div>
<!-- Stats Grid -->
<dl class="stats-grid">
<!-- Stat 1: Time Saved -->
<div class="stat-card">
<dt>
<div class="stat-icon">
<svg fill="none" viewBox="0 0 24 24" stroke-width="1.5" stroke="currentColor" aria-hidden="true">
<path stroke-linecap="round" stroke-linejoin="round" d="M12 6v6h4.5m4.5 0a9 9 0 11-18 0 9 9 0 0118 0z" />
</svg>
</div>
<p class="stat-title">Time Saved</p>
</dt>
<dd class="stat-content">
<p class="stat-value">15+ hrs</p>
<p class="stat-description">Weekly administrative time saved per employee</p>
</dd>
</div>
<!-- Stat 2: Revenue Increase -->
<div class="stat-card">
<dt>
<div class="stat-icon">
<svg fill="none" viewBox="0 0 24 24" stroke-width="1.5" stroke="currentColor" aria-hidden="true">
<path stroke-linecap="round" stroke-linejoin="round" d="M2.25 18L9 11.25l4.306 4.307a11.95 11.95 0 015.814-5.519l2.74-1.22m0 0l-5.94-2.28m5.94 2.28l-2.28 5.941" />
</svg>
</div>
<p class="stat-title">Revenue Growth</p>
</dt>
<dd class="stat-content">
<p class="stat-value">32%</p>
<p class="stat-description">Average increase in annual revenue</p>
</dd>
</div>
<!-- Stat 3: Cost Reduction -->
<div class="stat-card">
<dt>
<div class="stat-icon">
<svg fill="none" viewBox="0 0 24 24" stroke-width="1.5" stroke="currentColor" aria-hidden="true">
<path stroke-linecap="round" stroke-linejoin="round" d="M12 6v12m-3-2.818l.879.659c1.171.879 3.07.879 4.242 0 1.172-.879 1.172-2.303 0-3.182C13.536 12.219 12.768 12 12 12c-.725 0-1.45-.22-2.003-.659-1.106-.879-1.106-2.303 0-3.182s2.9-.879 4.006 0l.415.33M21 12a9 9 0 11-18 0 9 9 0 0118 0z" />
</svg>
</div>
<p class="stat-title">Cost Reduction</p>
</dt>
<dd class="stat-content">
<p class="stat-value">28%</p>
<p class="stat-description">Average decrease in operational costs</p>
</dd>
</div>
<!-- Stat 4: Customer Satisfaction -->
<div class="stat-card">
<dt>
<div class="stat-icon">
<svg fill="none" viewBox="0 0 24 24" stroke-width="1.5" stroke="currentColor" aria-hidden="true">
<path stroke-linecap="round" stroke-linejoin="round" d="M15.182 15.182a4.5 4.5 0 01-6.364 0M21 12a9 9 0 11-18 0 9 9 0 0118 0zM9.75 9.75c0 .414-.168.75-.375.75S9 10.164 9 9.75 9.168 9 9.375 9s.375.336.375.75zm-.375 0h.008v.015h-.008V9.75zm5.625 0c0 .414-.168.75-.375.75s-.375-.336-.375-.75.168-.75.375-.75.375.336.375.75zm-.375 0h.008v.015h-.008V9.75z" />
</svg>
</div>
<p class="stat-title">Customer Satisfaction</p>
</dt>
<dd class="stat-content">
<p class="stat-value">4.8/5</p>
<p class="stat-description">Average rating from 2,000+ businesses</p>
</dd>
</div>
</dl>
<!-- ROI Calculator -->
<div class="calculator">
<div class="calculator-container">
<h3 class="calculator-title">Calculate your potential ROI</h3>
<div class="calculator-grid">
<!-- Input Fields -->
<div class="input-grid">
<div class="input-group">
<label for="employees" class="input-label">Number of employees</label>
<input type="number" id="employees" class="input-field" placeholder="5">
</div>
<div class="input-group">
<label for="hourly-rate" class="input-label">Average hourly rate ($)</label>
<input type="number" id="hourly-rate" class="input-field" placeholder="25">
</div>
<div class="input-group">
<label for="admin-hours" class="input-label">Weekly admin hours per employee</label>
<input type="number" id="admin-hours" class="input-field" placeholder="20">
</div>
<div class="input-group">
<label for="annual-revenue" class="input-label">Annual revenue ($)</label>
<input type="number" id="annual-revenue" class="input-field" placeholder="500000">
</div>
</div>
<!-- Results -->
<div class="results">
<h4 class="results-label">Your estimated annual savings</h4>
<p class="results-value" id="savings-result">$78,000</p>
<div class="results-cta">
<a href="#demo" class="cta-button" role="button" aria-label="Request a personalized ROI analysis">
Get detailed analysis
</a>
</div>
</div>
</div>
</div>
</div>
</div>
</div>
</section>
<script>
// Simple ROI calculator functionality
document.addEventListener('DOMContentLoaded', function() {
const employeesInput = document.getElementById('employees');
const hourlyRateInput = document.getElementById('hourly-rate');
const adminHoursInput = document.getElementById('admin-hours');
const annualRevenueInput = document.getElementById('annual-revenue');
const savingsResult = document.getElementById('savings-result');
const inputs = [employeesInput, hourlyRateInput, adminHoursInput, annualRevenueInput];
inputs.forEach(input => {
input.addEventListener('input', calculateROI);
});
function calculateROI() {
const employees = Number(employeesInput.value) || 5;
const hourlyRate = Number(hourlyRateInput.value) || 25;
const adminHours = Number(adminHoursInput.value) || 20;
const annualRevenue = Number(annualRevenueInput.value) || 500000;
// Calculate time savings (15 hours saved per week per employee)
const timeSavings = employees * 15 * hourlyRate * 52;
// Calculate revenue increase (32% of annual revenue)
const revenueIncrease = annualRevenue * 0.32;
// Calculate cost reduction (28% of operational costs - estimated as 40% of revenue)
const operationalCosts = annualRevenue * 0.4;
const costReduction = operationalCosts * 0.28;
// Total savings
const totalSavings = timeSavings + revenueIncrease + costReduction;
// Update the result
savingsResult.textContent = '$' + Math.round(totalSavings).toLocaleString();
}
// Initial calculation
calculateROI();
});
</script>
                <!--
@type: Stats
@industry: Software
@style: Minimal
@category: Page Section, Social Proof
@framework: Tailwind
@license: Free
-->

<section class="bg-white py-16 sm:py-24" aria-labelledby="stats-heading">
  <div class="mx-auto max-w-7xl px-4 sm:px-6 lg:px-8">
    <div class="mx-auto max-w-2xl lg:max-w-none">
      <div class="text-center">
        <span class="text-lg font-semibold text-indigo-600">Real results for small businesses</span>
        <h2 id="stats-heading" class="mt-2 text-3xl font-bold tracking-tight text-gray-900 sm:text-4xl">
          Measurable impact on your business
        </h2>
        <p class="mt-4 text-lg text-gray-600">
          Our software helps small businesses achieve significant improvements across key performance metrics
        </p>
      </div>

      <!-- Stats Grid -->
      <dl class="mt-16 grid grid-cols-1 gap-y-10 gap-x-8 sm:grid-cols-2 lg:grid-cols-4">
        <!-- Stat 1: Time Saved -->
        <div class="relative bg-white p-6 border border-gray-200 rounded-lg shadow-sm">
          <dt>
            <div class="absolute flex h-12 w-12 items-center justify-center rounded-md bg-indigo-500 text-white">
              <svg class="h-6 w-6" fill="none" viewBox="0 0 24 24" stroke-width="1.5" stroke="currentColor" aria-hidden="true">
                <path stroke-linecap="round" stroke-linejoin="round" d="M12 6v6h4.5m4.5 0a9 9 0 11-18 0 9 9 0 0118 0z" />
              </svg>
            </div>
            <p class="ml-16 text-lg font-medium text-gray-900">Time Saved</p>
          </dt>
          <dd class="ml-16 mt-2">
            <p class="text-3xl font-bold tracking-tight text-indigo-600">15+ hrs</p>
            <p class="mt-1 text-sm text-gray-500">Weekly administrative time saved per employee</p>
          </dd>
        </div>

        <!-- Stat 2: Revenue Increase -->
        <div class="relative bg-white p-6 border border-gray-200 rounded-lg shadow-sm">
          <dt>
            <div class="absolute flex h-12 w-12 items-center justify-center rounded-md bg-indigo-500 text-white">
              <svg class="h-6 w-6" fill="none" viewBox="0 0 24 24" stroke-width="1.5" stroke="currentColor" aria-hidden="true">
                <path stroke-linecap="round" stroke-linejoin="round" d="M2.25 18L9 11.25l4.306 4.307a11.95 11.95 0 015.814-5.519l2.74-1.22m0 0l-5.94-2.28m5.94 2.28l-2.28 5.941" />
              </svg>
            </div>
            <p class="ml-16 text-lg font-medium text-gray-900">Revenue Growth</p>
          </dt>
          <dd class="ml-16 mt-2">
            <p class="text-3xl font-bold tracking-tight text-indigo-600">32%</p>
            <p class="mt-1 text-sm text-gray-500">Average increase in annual revenue</p>
          </dd>
        </div>

        <!-- Stat 3: Cost Reduction -->
        <div class="relative bg-white p-6 border border-gray-200 rounded-lg shadow-sm">
          <dt>
            <div class="absolute flex h-12 w-12 items-center justify-center rounded-md bg-indigo-500 text-white">
              <svg class="h-6 w-6" fill="none" viewBox="0 0 24 24" stroke-width="1.5" stroke="currentColor" aria-hidden="true">
                <path stroke-linecap="round" stroke-linejoin="round" d="M12 6v12m-3-2.818l.879.659c1.171.879 3.07.879 4.242 0 1.172-.879 1.172-2.303 0-3.182C13.536 12.219 12.768 12 12 12c-.725 0-1.45-.22-2.003-.659-1.106-.879-1.106-2.303 0-3.182s2.9-.879 4.006 0l.415.33M21 12a9 9 0 11-18 0 9 9 0 0118 0z" />
              </svg>
            </div>
            <p class="ml-16 text-lg font-medium text-gray-900">Cost Reduction</p>
          </dt>
          <dd class="ml-16 mt-2">
            <p class="text-3xl font-bold tracking-tight text-indigo-600">28%</p>
            <p class="mt-1 text-sm text-gray-500">Average decrease in operational costs</p>
          </dd>
        </div>

        <!-- Stat 4: Customer Satisfaction -->
        <div class="relative bg-white p-6 border border-gray-200 rounded-lg shadow-sm">
          <dt>
            <div class="absolute flex h-12 w-12 items-center justify-center rounded-md bg-indigo-500 text-white">
              <svg class="h-6 w-6" fill="none" viewBox="0 0 24 24" stroke-width="1.5" stroke="currentColor" aria-hidden="true">
                <path stroke-linecap="round" stroke-linejoin="round" d="M15.182 15.182a4.5 4.5 0 01-6.364 0M21 12a9 9 0 11-18 0 9 9 0 0118 0zM9.75 9.75c0 .414-.168.75-.375.75S9 10.164 9 9.75 9.168 9 9.375 9s.375.336.375.75zm-.375 0h.008v.015h-.008V9.75zm5.625 0c0 .414-.168.75-.375.75s-.375-.336-.375-.75.168-.75.375-.75.375.336.375.75zm-.375 0h.008v.015h-.008V9.75z" />
              </svg>
            </div>
            <p class="ml-16 text-lg font-medium text-gray-900">Customer Satisfaction</p>
          </dt>
          <dd class="ml-16 mt-2">
            <p class="text-3xl font-bold tracking-tight text-indigo-600">4.8/5</p>
            <p class="mt-1 text-sm text-gray-500">Average rating from 2,000+ businesses</p>
          </dd>
        </div>
      </dl>

      <!-- ROI Calculator -->
      <div class="mt-16 bg-gray-50 border-2 border-indigo-200 rounded-xl p-8">
        <div class="mx-auto max-w-3xl">
          <h3 class="text-xl font-bold text-gray-900 mb-6">Calculate your potential ROI</h3>

          <div class="grid grid-cols-1 md:grid-cols-3 gap-6">
            <!-- Input Fields -->
            <div class="col-span-2 grid grid-cols-1 sm:grid-cols-2 gap-4">
              <div>
                <label for="employees" class="block text-sm font-medium text-gray-700 mb-2">Number of employees</label>
                <input type="number" id="employees" class="mt-1 block w-full rounded-md border border-gray-300 shadow-sm focus:border-indigo-500 focus:ring-indigo-500 text-base py-3 px-4" placeholder="5">
              </div>

              <div>
                <label for="hourly-rate" class="block text-sm font-medium text-gray-700 mb-2">Average hourly rate ($)</label>
                <input type="number" id="hourly-rate" class="mt-1 block w-full rounded-md border border-gray-300 shadow-sm focus:border-indigo-500 focus:ring-indigo-500 text-base py-3 px-4" placeholder="25">
              </div>

              <div>
                <label for="admin-hours" class="block text-sm font-medium text-gray-700 mb-2">Weekly admin hours per employee</label>
                <input type="number" id="admin-hours" class="mt-1 block w-full rounded-md border border-gray-300 shadow-sm focus:border-indigo-500 focus:ring-indigo-500 text-base py-3 px-4" placeholder="20">
              </div>

              <div>
                <label for="annual-revenue" class="block text-sm font-medium text-gray-700 mb-2">Annual revenue ($)</label>
                <input type="number" id="annual-revenue" class="mt-1 block w-full rounded-md border border-gray-300 shadow-sm focus:border-indigo-500 focus:ring-indigo-500 text-base py-3 px-4" placeholder="500000">
              </div>
            </div>

            <!-- Results -->
            <div class="bg-white p-6 rounded-lg border border-gray-300 shadow-sm">
              <h4 class="text-sm font-medium text-gray-500 mb-2">Your estimated annual savings</h4>
              <p class="text-3xl font-bold text-indigo-600" id="savings-result">$78,000</p>
              <div class="mt-4 pt-4 border-t border-gray-100">
                <a href="#demo" class="inline-flex items-center justify-center rounded-md border border-transparent bg-indigo-600 px-4 py-2 text-sm font-medium text-white shadow-sm hover:bg-indigo-700 focus:outline-none focus:ring-2 focus:ring-indigo-500 focus:ring-offset-2" role="button" aria-label="Request a personalized ROI analysis">
                  Get detailed analysis
                </a>
              </div>
            </div>
          </div>
        </div>
      </div>
    </div>
  </div>
</section>

<script>
  // Simple ROI calculator functionality
  document.addEventListener('DOMContentLoaded', function() {
    const employeesInput = document.getElementById('employees');
    const hourlyRateInput = document.getElementById('hourly-rate');
    const adminHoursInput = document.getElementById('admin-hours');
    const annualRevenueInput = document.getElementById('annual-revenue');
    const savingsResult = document.getElementById('savings-result');

    const inputs = [employeesInput, hourlyRateInput, adminHoursInput, annualRevenueInput];

    inputs.forEach(input => {
      input.addEventListener('input', calculateROI);
    });

    function calculateROI() {
      const employees = Number(employeesInput.value) || 5;
      const hourlyRate = Number(hourlyRateInput.value) || 25;
      const adminHours = Number(adminHoursInput.value) || 20;
      const annualRevenue = Number(annualRevenueInput.value) || 500000;

      // Calculate time savings (15 hours saved per week per employee)
      const timeSavings = employees * 15 * hourlyRate * 52;

      // Calculate revenue increase (32% of annual revenue)
      const revenueIncrease = annualRevenue * 0.32;

      // Calculate cost reduction (28% of operational costs - estimated as 40% of revenue)
      const operationalCosts = annualRevenue * 0.4;
      const costReduction = operationalCosts * 0.28;

      // Total savings
      const totalSavings = timeSavings + revenueIncrease + costReduction;

      // Update the result
      savingsResult.textContent = '$' + Math.round(totalSavings).toLocaleString();
    }

    // Initial calculation
    calculateROI();
  });
</script>
This is a Pro component
Access the full component collection
Get all premium components and focus on building your business
Unlock for $49
(one-time payment)Early bird discount. Lock in this price forever
Premium components
Get access to all pro components. New ones added monthly
Save components
Save your favorite components to your account
Unlimited usage
Use components as often as you want
Landing page submissions
Get your landing pages featured on LandingGo and earn a
strong backlink
 21 DR dofollow backlink from the main page